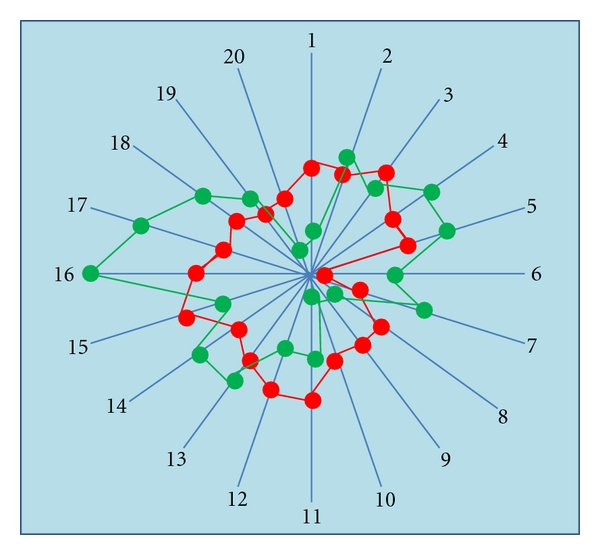
Figure 2.

Comparison of QRT-PCR expression patterns for 5-HT2B in 20 tissues from mouse (red) and human (blue). Each numbered radial arm represents a different tissue type, and concentric circles represent magnitude of gene expression in mRNA copy number per 100 ng total RNA. Data points are mean values from 3 independent values (i.e., generated from 3 samples of each tissue type, each obtained from a separate animal/donor). Tissues are (1) heart, (2) oesophagus, (3) stomach, (4) jejunum, (5) colon, (6) pancreas, (7) liver, (8) cerebellum, (9) frontal cortex, (10) spinal cord, (11) trachea, (12) lung parenchyma, (13) kidney, (14) bladder, (15) ovary, (16) uterus, (17) vas deferens, (18) testis, (19) spleen, (20) skin. (see Coleman, [26]).
