
Figure 3.
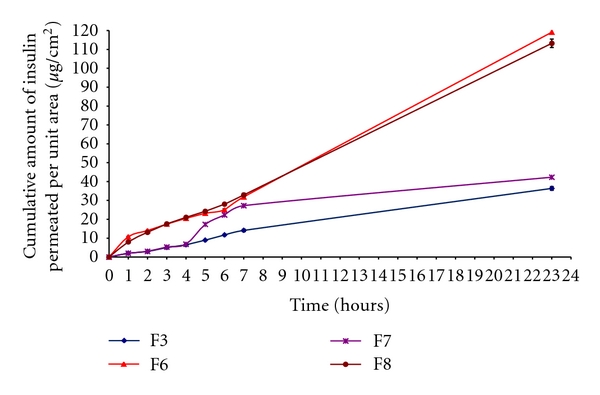
In vitro insulin permeation profile through goat skin per unit area from selected insulin-loaded microemulsions (F3 and F6) without and with 2% DMSO as permeation enhancer (F7 and F8). (mean ± standard error, n = 3).
Official websites use .gov
A
.gov website belongs to an official
government organization in the United States.
Secure .gov websites use HTTPS
A lock (
) or https:// means you've safely
connected to the .gov website. Share sensitive
information only on official, secure websites.
In vitro insulin permeation profile through goat skin per unit area from selected insulin-loaded microemulsions (F3 and F6) without and with 2% DMSO as permeation enhancer (F7 and F8). (mean ± standard error, n = 3).