Figure 2.

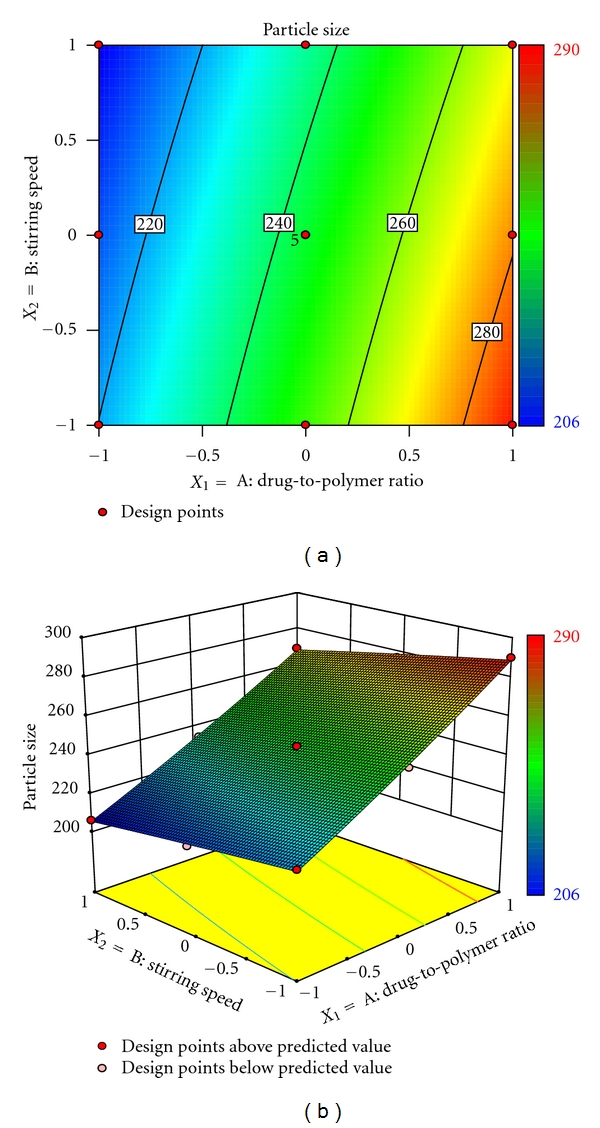
(a) Response surface plot showing the influence of drug-to-polymer ratio and stirring speed on mean particle size (μm) and (b) corresponding contour plot showing the relationship between various levels of 2 independent variables.

(a) Response surface plot showing the influence of drug-to-polymer ratio and stirring speed on mean particle size (μm) and (b) corresponding contour plot showing the relationship between various levels of 2 independent variables.