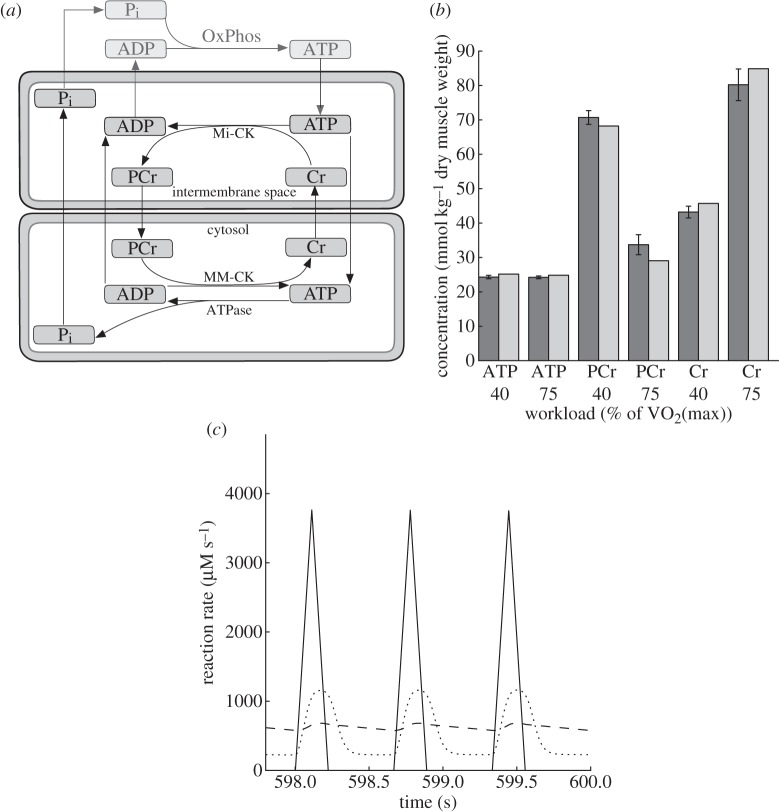
Figure 3.
(a) Scheme of the model of the creatine kinase (CK) system. Cell and mitochondrial membranes are indicated. Cr, creatine; PCr, phosphocreatine; Pi, inorganic phosphate; OxPhos, oxidative phosphorylation. (b) Steady-state metabolite concentrations at the end of a 600 s simulation compared with data from cycling exercise experiments at different submaximal workloads [26]. For conversion of metabolite concentrations between model (μmol l−1 cell water) and data (mmol kg−1 dry weight), we assumed an intracellular water content of 3 l kg−1 dry muscle weight [27]. (c) Model prediction of the ATP synthesis time course at 100% (dashed line) and 2% (dotted line) of normal CK activity at a workload of 40% of VO2max. The forcing function of pulsatile ATP hydrolysis is plotted as a solid line. Note that the last 2 s of a simulation over 600 s are shown ensuring a steady state. (b) Dark grey, data; light grey, model prediction. (c) Dashed line, ATP synthesis, 100% CK; dotted line, ATP synthesis, 2% CK; solid line, ATP hydrolysis.

