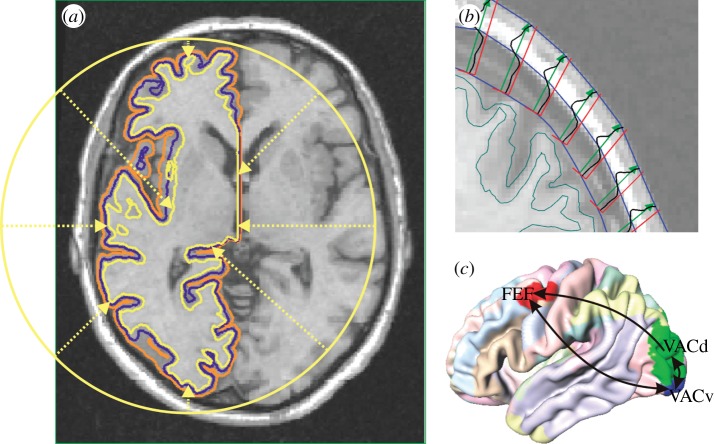
Figure 1.
(a) Neural population model surface (blue) between the Civet interfaces of grey matter with white matter (yellow) and cerebrospinal fluid (orange). (b) Skull and scalp boundaries (blue) from intensity profiles (black) along outward vectors (green). (c) Visual connectivity used in this study. ‘Regional map’ areas are indicated by colours on an average cortical surface. FEF, frontal eye field; VACd and VACv, dorsal and ventral anterior visual cortex.

