
Figure 3.
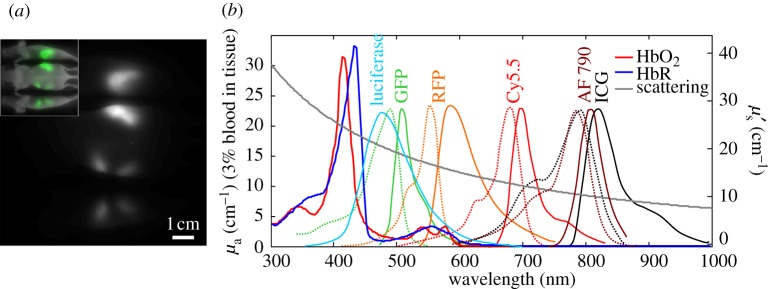
Autofluorescence, haemoglobin absorption spectra and scattering compared with common fluorescent dye spectra. (a) A three-view image of a nude mouse acquired with 570±20 nm excitation and 600 nm long-pass emission. Inset shows the signal colour-coded green and overlaid on a white-light image. No dye was administered; image shows autofluorescence from food in the intestines. (b) Absorption spectra of oxy- and deoxy-haemoglobin (HbO2 and HbR), luciferase emission, and excitation (dots) and emission (solid) spectra of common fluorophores (GFP/RFP = green/red fluorescent protein, AF790 = Alexa-Fluor 790, ICG = indocyanine green (Invitrogen)) [13,14]. Reduced scattering spectrum is approximated using: μ′s = Aλ−b, where A=1.14×10⁻⁷m(b−1) and b=1.3 [15].