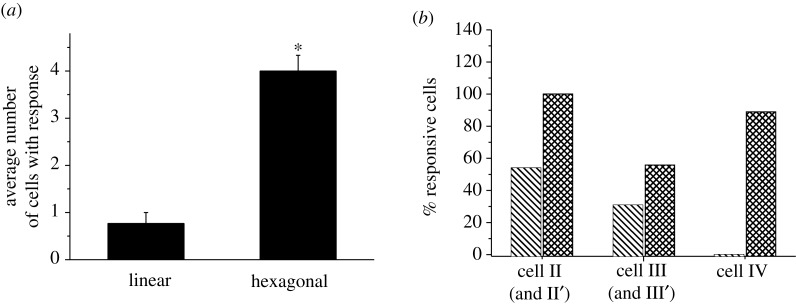
Figure 5.
Transferred distance of calcium signalling in the linear (untreated group) and hexagonal bone cell networks. (a) Average number of cells that showed calcium responses after indentation stimulation on a cell in the network (itself excluded) and (b) percentage of cells that showed calcium responses at different positions. The error bars are s.e.m., while the asterisk indicates statistical significance of p<0.05 with linear pattern. Bars with cross lines indicate linear pattern; bars with squared lines indicate hexagonal pattern.

