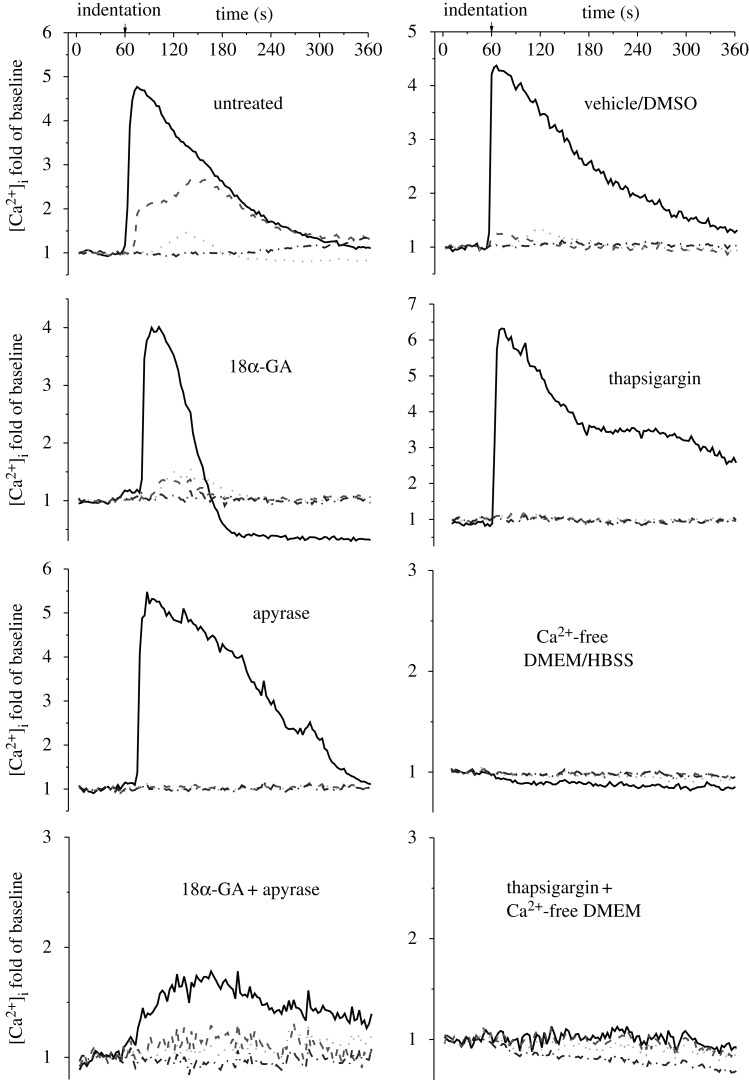
Figure 7.
Typical [Ca2+]i transients of each individual cell in the linear bone cell networks for all inhibitor-treated groups. The [Ca2+]i responses of bone cell networks were recorded for 6 min, 1 min for baseline and 5 min during mechanical stimulation. The [Ca2+]i concentration is represented by the cell image intensity normalized to the average value of baseline images. Solid lines, cell I; dashed lines, cell II; dotted lines, cell III; dashed dotted lines, cell IV.

