Figure 7.
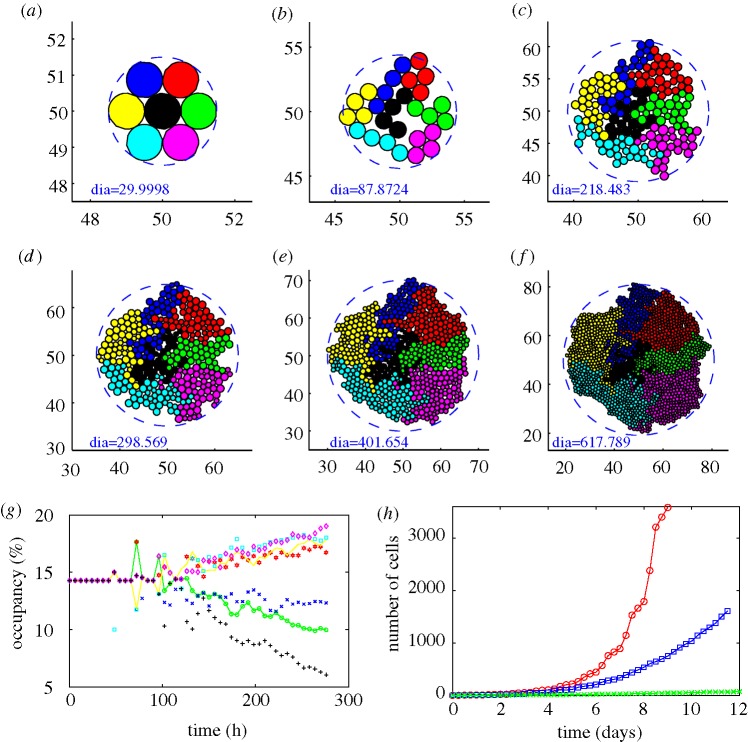
Tumour growth in the presence of adequate nutrients. (a–f) Tumour growth. Parameters σ−=−4.0 nN, σ+=800.0 nN, c+=5.16089× 10⁻⁹ mm (min nN)−1 were used. (a) t=0 h, 7 cells; (b) t=60 h, 28 cells; (c) t=132 h, 179 cells; (d) t=168 h, 343 cells; (e) t=204 h, 650 cells; (f) t=276 h, 1614 cells. Diameter inside each figure is in the unit of 10 μm. (g) The occupancy (%) for each clone corresponding to (a–f). Notice that the occupancy by cells in the central clone (black cells) decreases significantly compared to other types due to the stress effect on growth. (h) Growth kinetics for different level of the compression parameter σ−=−400 nN (red circles), −4 nN (blue squares) and −0.04 nN (green crosses).

