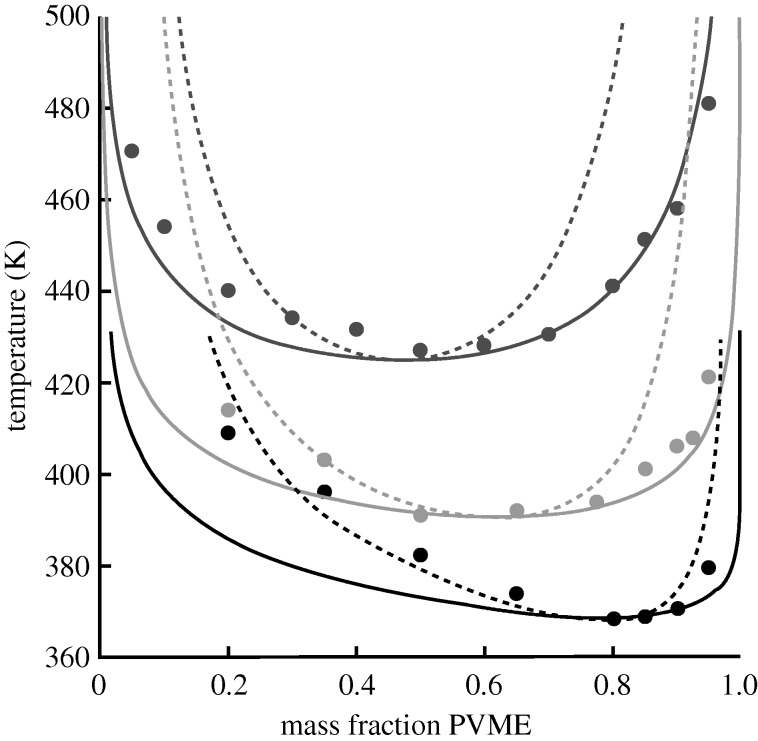
Figure 3.
Predicted phase diagrams for the polystyrene/poly(vinyl methyl ether) (PS/PVME) blend at varied molecular weights. The diagrams show both the theoretical binodal (solid) and spinodal (dashed) curves; experimental data are given by points (Nishi & Kwei 1975). The results for three systems are shown, where, from top to bottom, the PS molecular weights (Mw, in g mol−1) are 20 400 (dark grey), 51 000 (light grey) and 200 000 (black). In all cases the PVME molecular weight was 51 500. The pure component parameters were obtained from fits to PVT data which were weighted for best agreement at low pressure (Zoller & Walsh 1995, PS; and Ougizawa et al. 1991, PVME). The parameters for PS are r/Mw=0.113767 mol g−1 and ε=−2144.3 J mol−1; those for PVME are r/Mw= 0.115343 mol g−1 and ε=−1948.7 J mol−1. A single v=7.667 ml mol−1 (a compromise, required to model the mixture) applies to both components. Only one point has been fitted (to obtain g=1.00121), that being the LCST value for the phase diagram at the bottom (PS Mw=200 000).

