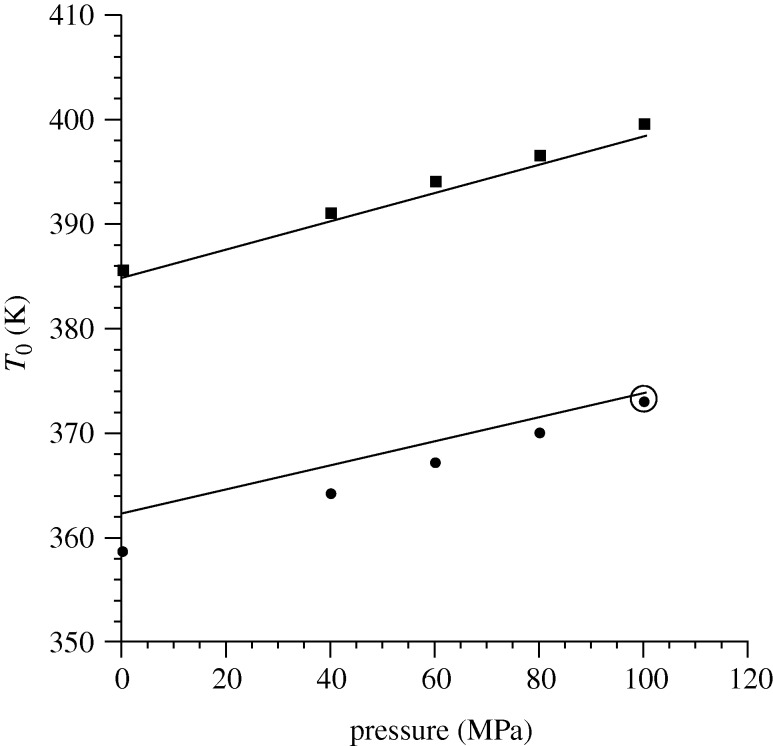
Figure 4.
Pressure and molecular weight dependence of the UCST for the polystyrene/ polybutadiene (PS/PB) blend. Model predictions (parameter from Higgins et al. (2005, tables 1 and 2)) are given by curves showing the UCST as a function of pressure; experimental results (Tripathi 1979) are given by solid symbols. The upper curve is for a blend with molecular weights of 3900 (PS) and 920 (PB) g mol−1. The lower curve is for molecular weights of 1200 (PS) and 2350 (PB) g mol−1. One datum point, the experimental point circled on the lower plot at 100 MPa, was used to fit the parameter g. Adapted from Higgins et al. (2005).

