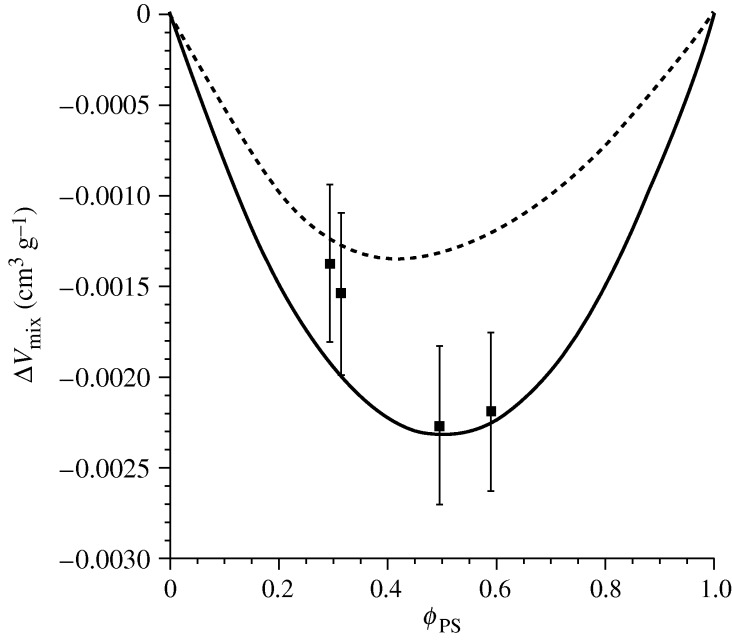
Figure 6.
Volume change on mixing for a polystyrene/poly(vinyl methyl ether) (PS/PVME) blend with molecular weights of 110 000 (PS) and 52 800 (PVME) g mol−1. Experimental data (symbols) are from Shiomi et al. (1990). Two theoretical curves are shown, each representing a different route to the characteristic parameters. The dashed curve is derived from fitting the parameters (Tambasco 2006, table 4.6) to blend PVT data (using the datasets for mass fractions of 30/70 and 70/30; Zoller & Walsh (1995)). The solid curve (parameters from Higgins et al. (2005, tables 1 and 2)) gives the results obtained by fitting to pure component PVT data (Zoller & Walsh 1995) along with a g-value obtained by matching to the experimental LCST (Beaucage et al. 1991).

