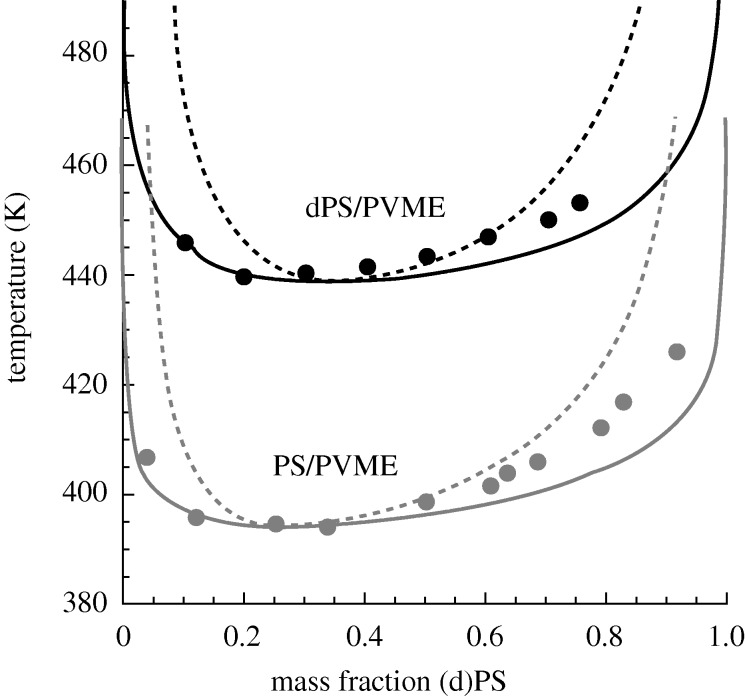
Figure 8.
Comparison of hPS/PVME and dPS/PVME phase diagrams. Results are shown for both the theoretical binodal (solid) and spinodal (dashed) curves; experimental data are given by points. The lower diagram (grey) corresponds to the hydrogenated hPS/PVME blend (molecular weights of 120 000/99 000 g mol−1; experimental data from Beaucage et al. (1991)), the upper diagram (black) corresponds to the deuterated dPS/PVME blend (molecular weights of 119 000/99 000 g mol−1; experimental data from Yang et al. (1986)). The pure component hPS and PVME parameters are the same as those described in the caption of figure 3. The dPS pure component parameters are v=7.667 ml mol−1, r/Mw= 0.105605 mol g−1 and ε=−2106.0 J mol−1; these were obtained by fitting to SANS data for the dPS/PVME blend (Shibayama et al. 1985) where we imposed the same v as for hPS and PVME. The g-value for the dPS/PVME blend is 1.00098 and was also obtained from the SANS fit. g for the hPS/PVME blend is 1.00132 and was obtained by fitting to the experimental LCST in Beaucage et al. (1991).

