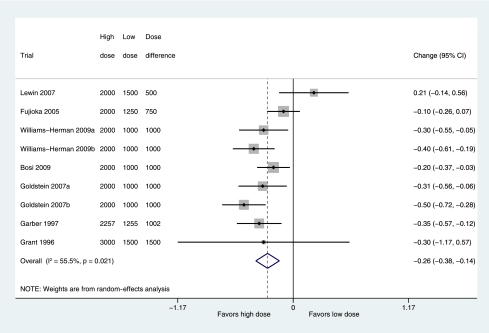
Figure 3.
Mean difference (boxes) in change in HbA1c of high dose metformin, combining trial arms allocated to at least 2,000 mg metformin, versus low dose metformin, combining trial arms allocated to 1,000–1,500 mg metformin, showing pooled estimates (diamonds) calculated by the random-effects DerSimonian and Laird method. Horizontal bars and diamond widths denote 95% CIs, and box sizes indicate relative weight in the analysis. (A high-quality color representation of this figure is available in the online issue.)

