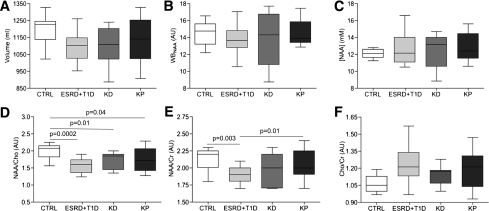
Figure 2.
MRI and 1H MRS evaluation were performed in the four groups of patients. No differences between groups were evident for brain volume (A), WBNAA (B), and [NAA] (C). NAA/Cho (D) and NAA/creatinine (Cr) (E) were significantly lower in ESRD plus T1D patients compared with control (CTRL) subjects and were near normalized in KP- but not KD-transplanted patients. The Cho-to-creatinine ratio is shown as well (F).

