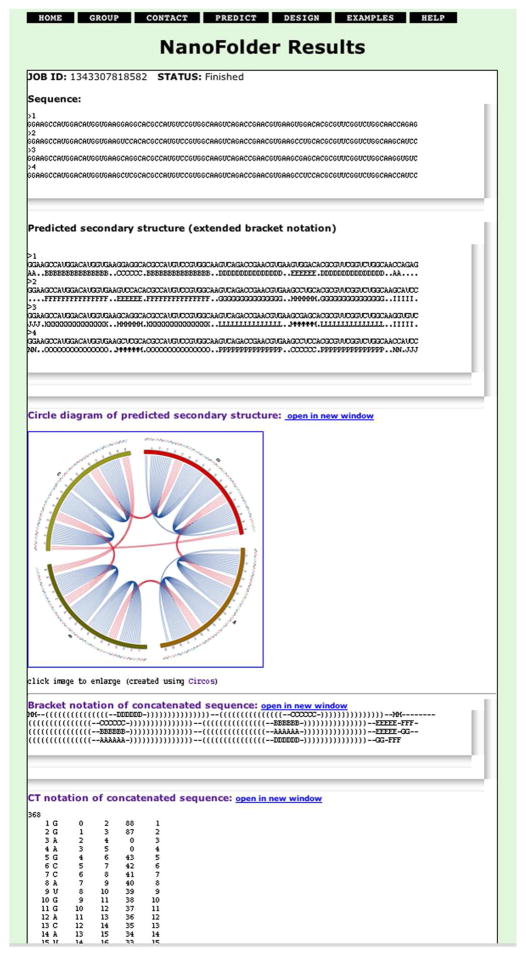
Figure 5.
Screenshot of a secondary structure prediction result generated by the NanoFolder web server. The RNA sequences used as “input” for the web server (labeled in the screenshot as “Sequence”) correspond to an RNA-square.1 The web server returns structure prediction results in 3 different text output formats (labeled in the screenshot as “Predicted secondary structure”, “Bracket notation of concatenated sequence” and “CT notation of concatenated sequence”). The predicted base pairing is depicted using a circular representation (labeled in the screenshot as “Circle diagram of predicted secondary structure”). The bottom part of the generated web page (containing the prediction result in tabular “CT” file format) is not shown in its entirety.

