Figure 4.
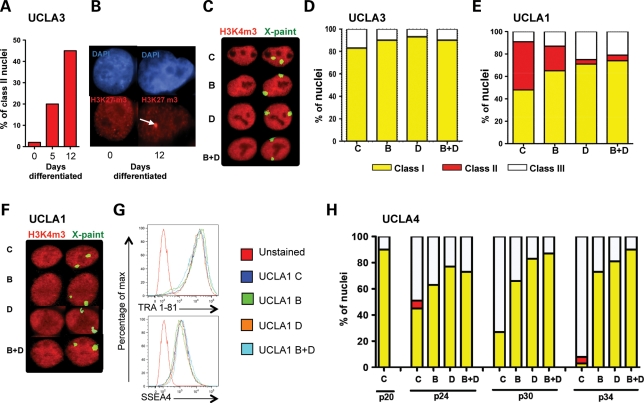
Reprogramming of new hESC lines. (A and B) Differentiation of UCLA3 for 12 days. (A) Quantification of H3K27me3 foci (class II) at day 0 (n = 599), day 5 (n = 259) and day 12 (n = 259). (B) Representative image of acquired H3K27me3 foci at day 12 (white arrow) relative to undifferentiated (day 0). (C) H3K4me3/X FISH at passage 24 to identify class I cells. Total nuclei counted in each condition include C (n = 30), B (n = 30), D (n = 30) and B + D (n = 30). (D) H3K27me3 staining was performed on a duplicate cover slip to identify class II nuclei. Total nuclei counted include C (572), B (476), D (507) and B + D (543). Data are shown as a composite of class I, II and III nuclei at passage 24 (note n = 0, class II nuclei). (E) UCLA1 after four passages in C, B, D, B + D, and quantification of class I, class II and class III nuclei. Nuclei counted using H3K27me3: C (466), B (532), D (596) and B + D (585). Nuclei counted using H3K4me3/X FISH (n = 31 each condition). (F) Images of H3K4me3/X FISH UCLA1 nuclei in each condition. (G) Flow plot showing TRA-1–81 and SSEA4 expression relative to secondary only control (unstained). (H) Class I, II and III nuclei at passages (p) 20, 24, 30 and 34 in UCLA4 as indicated. Calculations: class I = % nuclei with neither X chromosome in exclusion zone; class II = % nuclei with H3K27me3 foci; class III = % nuclei with one X chromosome in exclusion zone − % class II nuclei.

