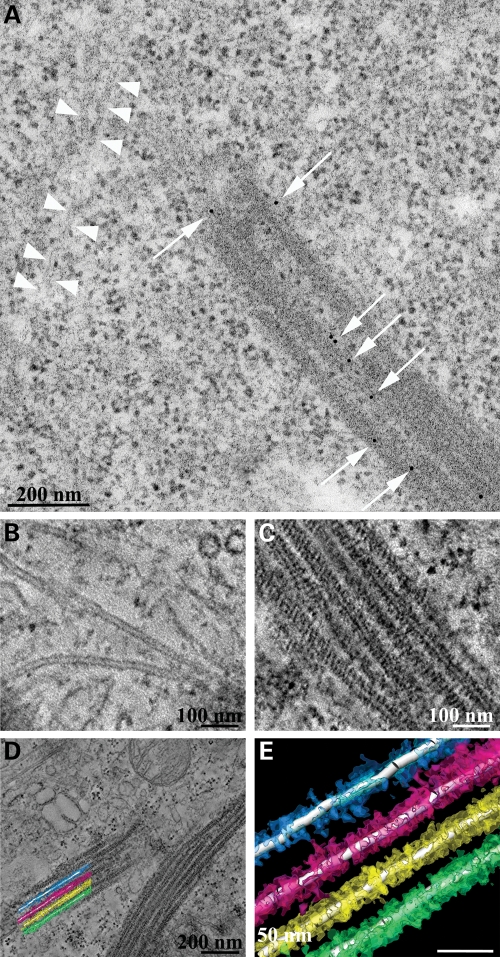
Figure 3.
Immuno-EM and electron tomography of LRRK2 filaments. (A) Immuno-EM was performed with a LRRK2-specific antibody. Immunogold signals appear as black dots (indicated by white arrows) on bundles of microtubules. For comparison, white arrowheads indicate a microtubule with the absence of LRRK2 staining. (B–E) Electron tomography of LRRK2 filaments. Higher magnification images of non-decorated tubules (B) and decorated microtubules (C) from electron tomograms are shown as well as a low power field from the area reconstructed by electron tomography (D) from which a graphical reconstruction was produced using Amira (E). These data are available for viewing and download from the Cell Centered Database either as images or 3D movies.

