Figure 1.
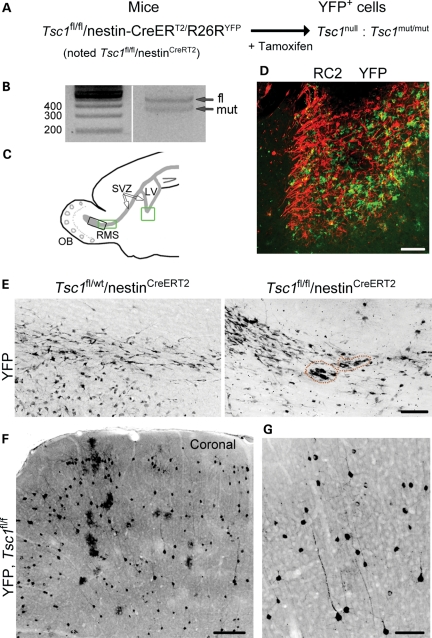
Postnatal deletion of Tsc1 using inducible transgenic mice. (A) The diagram illustrating the inducible transgenic mouse line used to delete Tsc1 (i.e. null) and express YFP in nestin-expressing cells and their progeny following tamoxifen injection at P7. (B) PCR gels from genomic DNA obtained from a P28 olfactory bulb following tamoxifen at P7. A mutant band in addition to the fl band is visible. (C) The diagram illustrating the locations of the images shown in (D) (ventral SVZ, green square) and in (E) (RMS, green square, for Tsc1fl/fl and black square for Tsc1fl/wt) on a sagittal section. LV, lateral ventricle; SVZ, subventricular zone; OB, olfactory bulb; RMS, rostral migratory stream. (D) The P28 image of the RC2 (red)-rich SVZ nodule containing YFP+ Tsc1null cells following tamoxifen-induced recombination at P7. (E) Confocal images of YFP-immunopositive cells in the RMS/RMS-OB of Tsc1fl/wt/nestinCreERT2 and RMS of Tsc1fl/fl/nestinCreERT2 following tamoxifen injections at P7. The dotted orange lines highlight small clusters of misplaced cells in the RMS. (F and G) Confocal images of YFP+ cells (low and high magnifications) in the cortex of Tsc1fl/fl/nestinCreERT2 mice. Scale bars: 70 µm (D, E and G) and 200 µm (F).

