Figure 3.
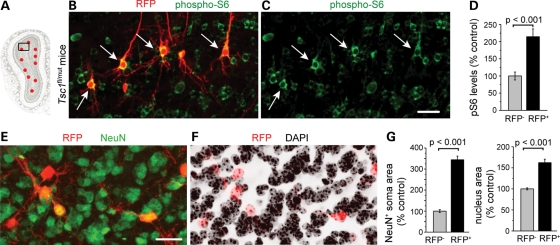
Tsc1 knockout hyper-activates the mTOR pathway and leads to cytomegaly. (A) The diagram of a coronal olfactory bulb section with the black square indicating the approximate location of the image in (B) and (C). (B and C) Confocal images of RFP fluorescence (red) and phospho-S6 immunostaining (green). Arrows point to neurons with an enlarged pS6 soma. (D) The bar graph of the pS6 intensity of all RFP+ neurons as a % of control RFP− neurons (mean ± SEM, t-test). (E and F) Confocal images of RFP fluorescence (red) and NeuN immunostaining (green, E) and DAPI counterstain (black, F). (G) Bar graphs of the NeuN+ soma area and the nuclear area as a % of control. Scale bars: 30 µm (B and C) and 20 µm (E and F).

