Figure 5.
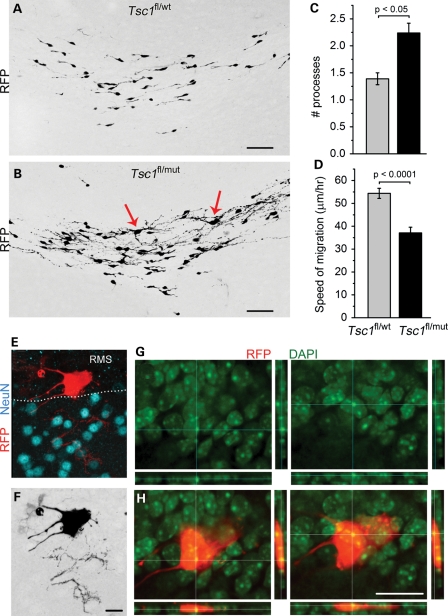
Tsc1null cells in the RMS display a hypertrophic morphology and are slow. (A and B) Confocal Z-stack images of RFP+ cells in the RMS of Tsc1fl/wt/R26R and Tsc1fl/mut/R26R mice. Bar graphs of the number of processes (C) and the speed of RFP+ cell migration (D) in Tsc1fl/wt/R26R (gray) and Tsc1fl/mut/R26R (black). (E) The confocal image of an enlarged RFP+ cells (red) and NeuN immunostaining (blue) in the RMS sending a process in the accessory olfactory nucleus. (F) The same cell as in (E) in black and white. (G and H) Projections from the same RFP+ cell (red) as in (E) and DAPI counterstain (green, alone in G) to illustrate the presence of two nuclei. Scale bars: 50 µm (A and B), 30 µm (F) and 40 µm (G).

