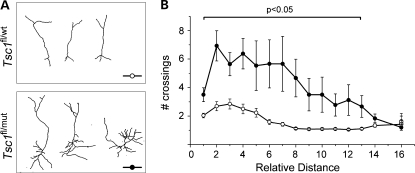
Figure 7.
Tsc1null neurons display a hypertrophic dendritic tree. (A) Representative reconstructions of RFP+ olfactory neurons in sections from Tsc1fl/wt/R26R and Tsc1fl/mut/R26R mice. (B) Corresponding plots of the number of crossing as a function of the distance from the soma (n = 14 cells for each plot). Filled circles: Tsc1fl/mut/R26R mice.

