Figure 2.
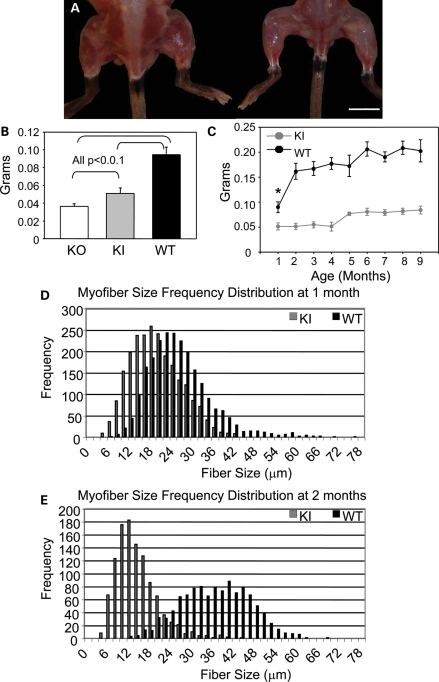
Significant but stable muscle atrophy occurs in Mtm1 p.R69C mice. (A) Gross photograph of 3-month-old Mtm1 p.R69C (right) shows significant muscle atrophy compared with a wild-type littermate (bar = 1 cm). (B) Bar plot showing that Mtm1 p.R69C quadriceps mass (0.05 ± 0.006 g) is intermediate to that of Mtm1 KO (0.036 ± 0.003 g) and wild-type littermates (0.095 ± 0.01 g) at 1 month of age [analysis of variance (ANOVA) P < 0.001; F = 213.21]. The P-values reported in B were obtained from post hoc testing. (C) Mtm1 p.R69C quadriceps mass is 30–40% that of wild-type littermates over a 9-month period (n = 8 for each group). Histograms of MinFeret diameters from Mtm1 p.R69C and wild-type littermate quadriceps at 1 (D) and 2 (E) months show that Mtm1 p.R69C myofibers (20.9 ± 3.8 µm) were significantly smaller than the wild-type (29.7 ± 8.4 µm) at 1 month (P = 0.006), but the difference in fiber size at 2 months is even more pronounced (Mtm1 p.R69C: 9.7 ± 3.3 µm versus wild-type: 36.7 ± 5.9 µm; P < 0.001) and this coincides with the onset of weakness. Abbreviations: KI, Mtm1 p.R69C; KO, Mtm1 knockout; WT, wild-type.

