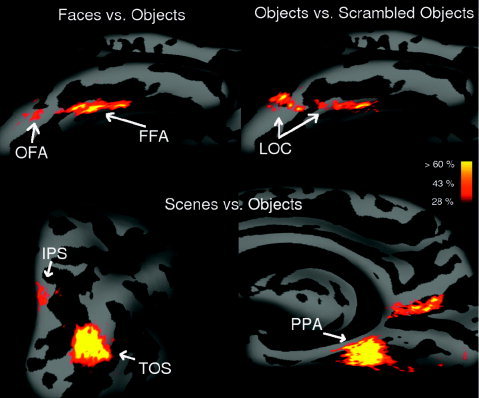
Figure 1.

Percentage overlap maps for the “faces vs. objects” (top left),“objects vs. scrambled objects” (top right), and “scenes vs. objects” (bottom) contrasts. The maps indicate the percentage of subjects who showed significant activation at the P < 10−4 level (uncorrected) individually at each point on the surface. Results are represented on an inflated right hemisphere brain of an average template brain. We represent here only overlaps of 4/14 subjects (28%) or higher.
