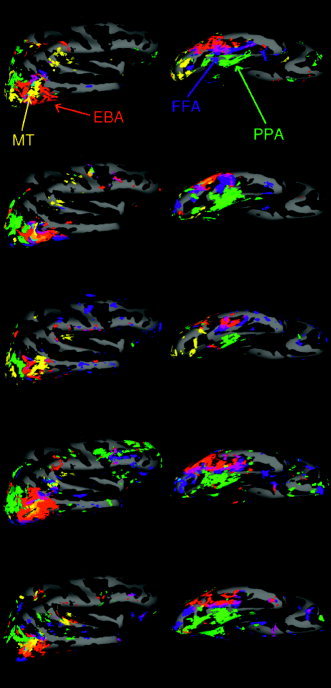
Figure 3.

Activation (for P < 10−4) for each contrast in five subjects mapped on an averaged template brain. Only the right hemisphere is represented. The colors identify the contrasts with the same color code as in Figure 2. In addition there is pale blue = overlap between “faces vs. objects” and “moving vs. stationary,” brown = overlap between “scenes vs. objects” and “moving vs. stationary,” and black = overlap between “faces vs. objects” and “scenes vs. objects”.
