
Figure 4.
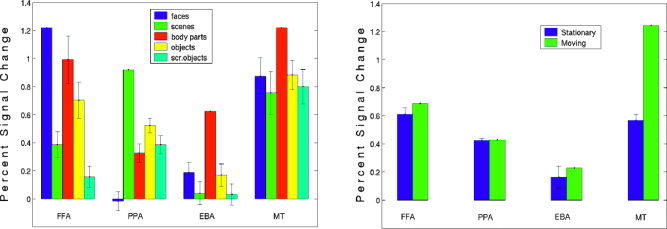
Analysis of the response properties of each region. For this analysis two scans were used to functionally define each region (at the P < 10−5 threshold); the percent signal change in each condition, compared to a fixation baseline, was calculated over the remaining three scans. Because the amount of data used to localize each region was limited, we did not find each area in each subject; the FFA was identified in 12 subjects, the PPA in all 14, the EBA in 12, and MT+ in 9 subjects. a: Mean percent signal change across subjects to each image category in the FFA, PPA, EBA, and MT+ regions in the right hemisphere. The error bars represent the standard error on the difference between the preferred and nonpreferred stimuli. In FFA, PPA, and EBA, paired sample t‐tests on the percent signal change gave values of P < 0.001 for all comparisons between the preferred category and each other category, except for the comparison between “faces” and “body parts” in the FFA, where P = 0.2 (t = 1.35). In MT+ the percent signal change for body parts is significantly higher than for the other categories (body parts vs. faces: t = 2.7 P < 0.02, body parts vs. scenes: t = 3.1 P < 0.01, body parts vs. objects: t = 3.2 P < 0.01, body parts vs. scrambled objects: t = 3.4 P < 0.005). b: Mean percent signal change across subjects to static and moving images in the FFA, PPA, EBA, and MT+ regions in the right hemisphere. The error bars represent the standard error of the difference between the preferred and nonpreferred stimuli. Paired sample t‐tests for responses to moving vs. static images were not significant (all P > 0.05) in any area except MT+, where the responses for moving images are significantly higher than for static images (t = 15.4, P < 0.001).