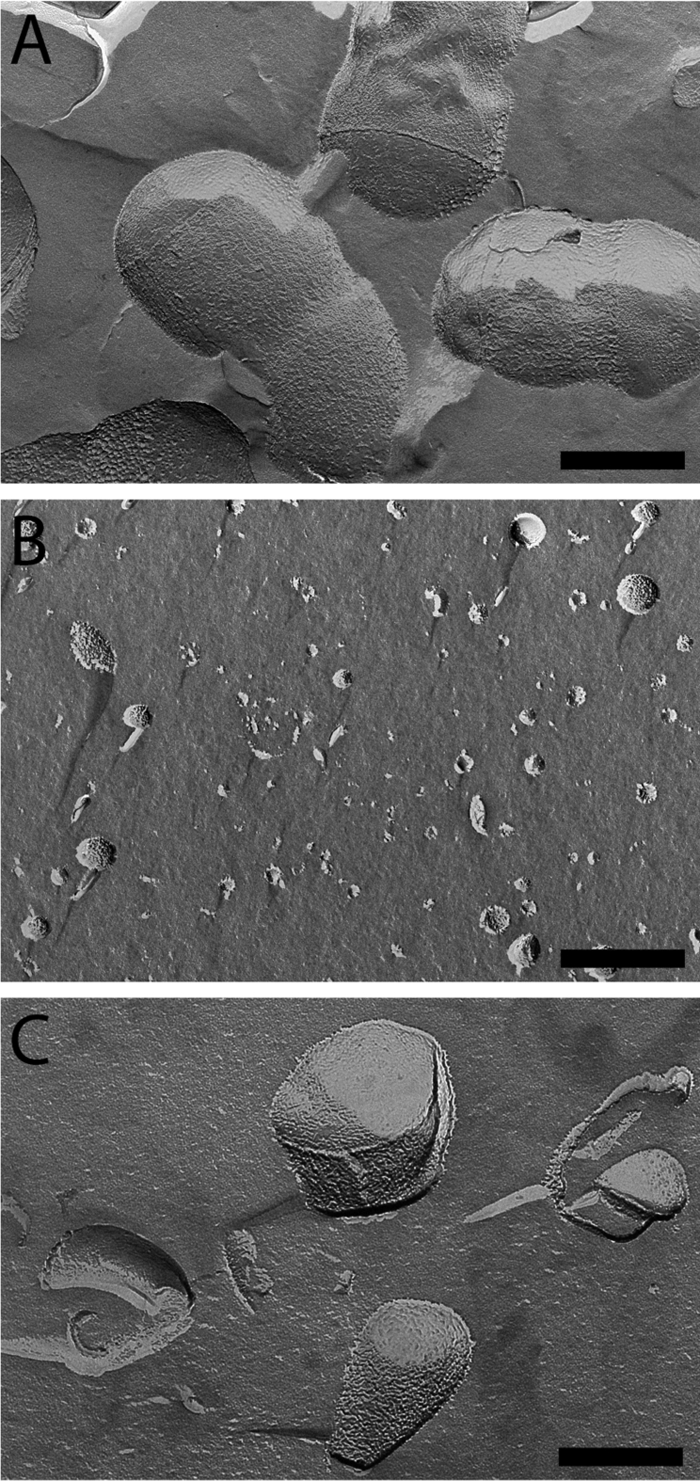
Fig 2.

Visualization of F1 and F2 fractions by freeze fracture electron microscopy. (A) Micrograph of C. glutamicum 13032 cells grown in BHI medium. (B and C) Micrograph of F1 (B) or F2 (C). All images are at the same magnification. Scale bar = 200 nm.
