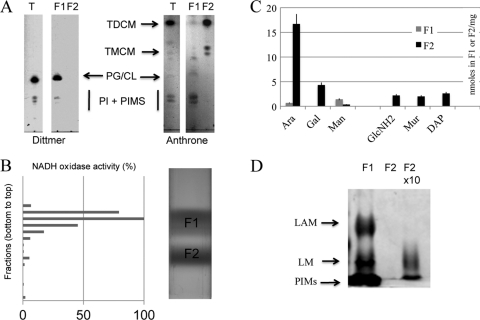
Fig 3.
Biochemical analysis of F1 and F2 fractions. (A) Polar lipids were isolated from F1 and F2 and separated on TLC plates. Phospholipids (phosphatidylglycerol [PG] and phosphatidylinositol [PI]) were visualized with the Dittmer reagent. PI derivatives, trehalose monocorynomyclate (TMCM) and trehalose dicorynomyclate (TMDM), were revealed by spraying anthrone. The T lane represents polar lipids extracted from whole cells. (B) NADH oxidase activity was monitored in all fractions collected from the gradient, and the initial velocity was plotted as a percentage of the highest activity (13.2 μmol · min−1). (C) Amino acids, sugars, and peptidoglycan (PG) markers were quantified from purified F1 and F2 fractions as described in Materials and Methods and expressed as nanomoles per milligram of dry material. Bars represent the standard errors of the means for 3 independent experiments. (D) Proteinase K-treated F1 and F2 fractions were loaded on a 15% SDS-polyacrylamide gel, and lipoglycans were revealed as described in Materials and Methods. According to dry weight, equal amounts of material were loaded for F1 and F2. The amount of material loaded in lane “F2 × 10” is 10 times higher than that in the two other lanes.

