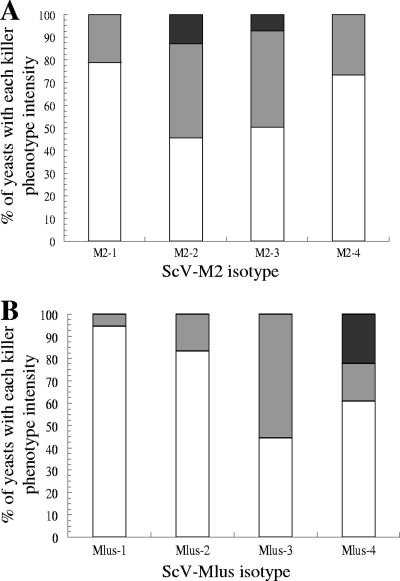
Fig 3.
Frequencies of yeast isolates containing each virus isotype with each killer phenotype intensity. (A) Yeasts containing M2 virus isotypes. (B) Yeasts containing Mlus virus isotypes. The thicknesses of the growth inhibition halos (killer phenotype intensities) were as follows: white, less than 1 mm; gray, 1 to 2 mm; black, more than 2 mm.

