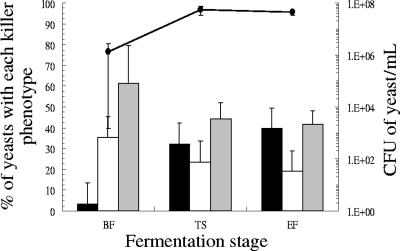
Fig 6.
Average changes in the proportion of killer yeasts during the VK-L and VK-H fermentations. White, nonkiller yeasts sensitive to K2 toxin; grey, nonkiller yeasts resistant to K2 toxin; and black, killer K2 and Klus yeasts. Dots and solid lines, CFU of yeast/ml. The data are the mean values of 17 VK-L and 8 VK-H fermentations. The error bars indicate standard errors of the mean.

