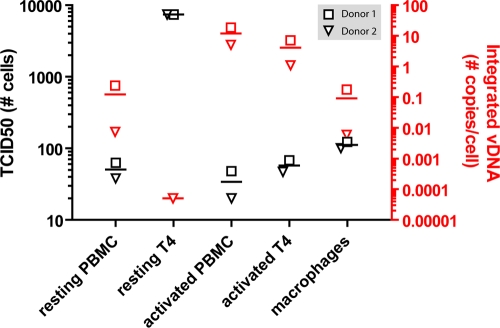
Fig 2.
Infectious titer and proviral DNA load of HIV-infected effector cells. The TCID50 of BaL-infected effector cells (i.e., resting PBMC/CD4+ T cells, activated PBMC/CD4+ T cells, and macrophages) was determined in a 7-day coculture with R5M target cells. Firefly luciferase was used to assess target cell infection, and the TCID50 was calculated using the method of Reed and Muench, expressed as the number of cells needed for 50% infection and plotted on the left y axis (black symbols). The integrated proviral DNA load was determined using a two-step Alu-Gag PCR. Each sample was tested in duplicate. Viral loads were calculated using an external curve for HIV proviral DNA by serially diluting 8E5 T cells and were plotted on the right y axis (red symbols). The threshold of detection was 100 copies/106 cells. The triangles and squares represent two PBMC donors from which the effector cells were generated. Horizontal lines represent the means of the depicted points.

