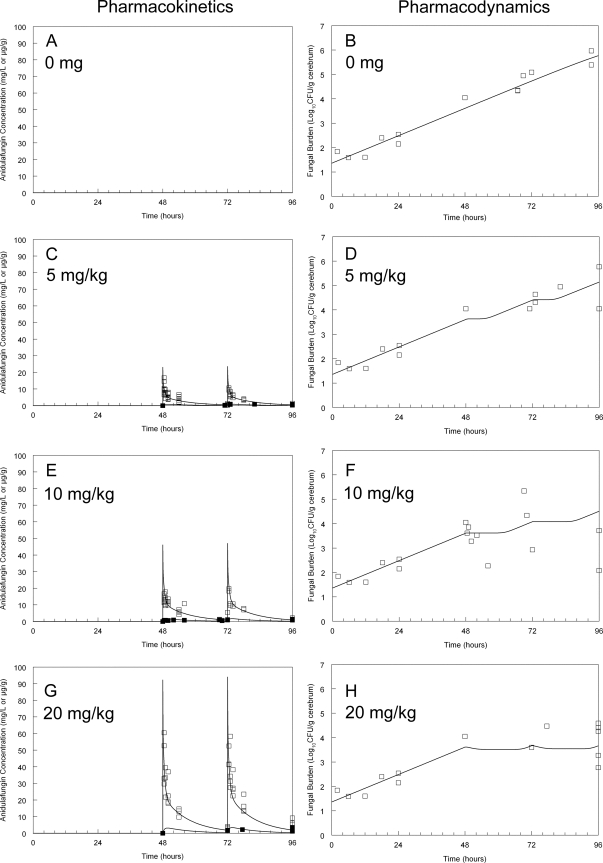
Fig 2.
The pharmacokinetics (A, C, G, and E) and pharmacodynamics (B, D, F, and H) of anidulafungin in rabbits against C. albicans in the cerebrum. Raw plasma and cerebral pharmacokinetic data are depicted by open and solid squares, respectively, in panels A, C, G, and E. The data from rabbits have been pooled. The raw pharmacodynamic data in panels B, D, F, and H are depicted by open squares. For the pharmacodynamics, each data point is derived from a single rabbit. The solid line is the fit of the population mathematical model to the pharmacokinetic and pharmacodynamic data.

