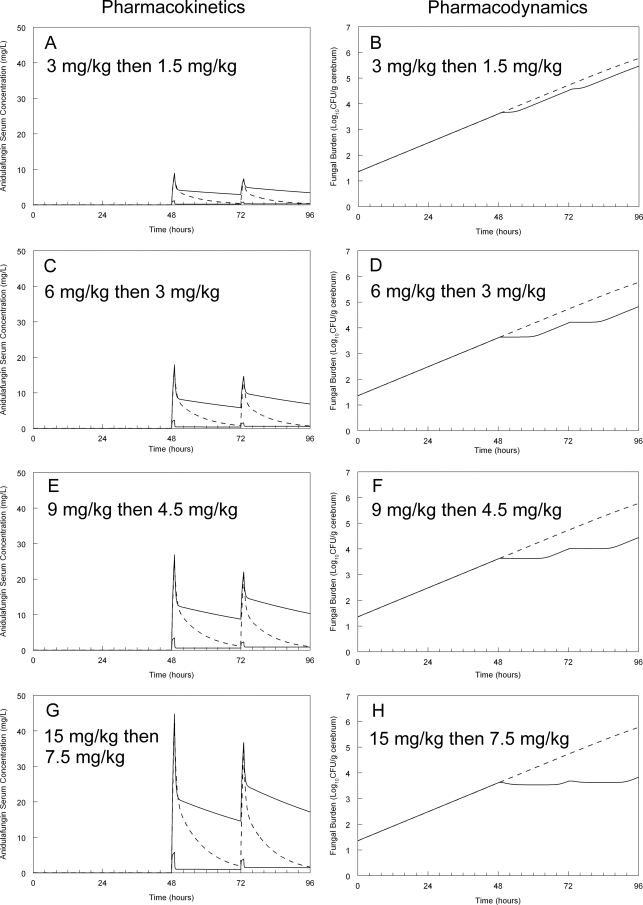
Fig 4.
Predicted antifungal effect resulting from various humanized anidulafungin regimens. The solid lines in the pharmacokinetic panels (A, C, G, and E) represent the lower 5th and upper 95th centiles for human neonates receiving anidulafungin. The dotted line in these panels is the concentration-time profile of a rabbit that has been administered anidulafungin (in silico) so that the peak touches the 95th human centile and then falls to the lower the lower 5th centile before redosing. The pharmacodynamic panels (B, D, F, and H) represent the predicted response to the humanized rabbit concentration-time profile. In these panels, the dotted line represents the increase in fungal density in untreated animals.

