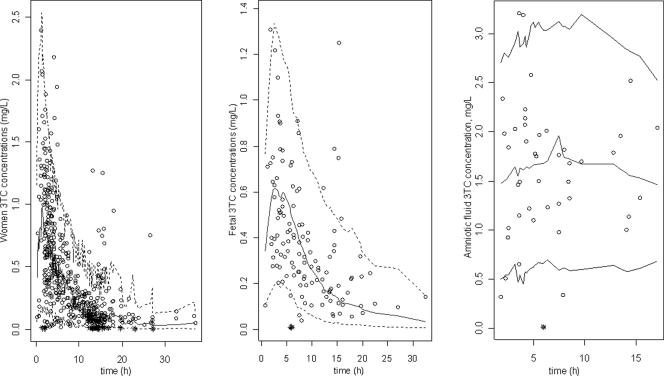
Fig 4.
Evaluation of the final model by comparison between the 5th (dash line), 50th (solid line), and 95th (dashed line) percentiles obtained from 1,000 simulations and the observed data (open circles) for lamivudine concentrations in women (left) and cord blood (right). Asterisks indicate concentrations lower than the LOQ.

