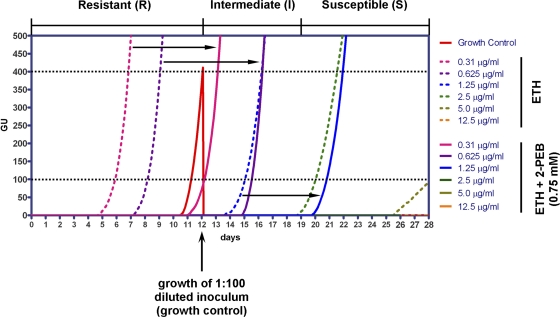
Fig 1.
Growth of M. tuberculosis H37Rv at different concentrations of ETH in the presence or absence of 2-PEB. Inoculation of a 1:100-diluted H37Rv suspension serves as a growth control (growth curve shown in red). Dotted lines at GU values of 100 and 400 indicate the thresholds for defining growth of strains under test conditions and growth of the control, respectively. See text for definition of resistant (R), intermediate (I), and susceptible (S). Black arrows indicate the shift of the growth curves with the addition of 2-PEB.

