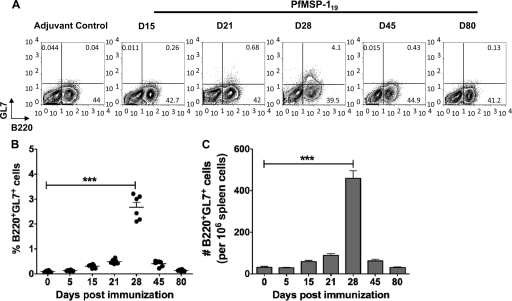
Fig 2.
A late germinal center B cell response is seen the PfMSP-119-primed mice. Splenocytes from PfMSP-119-primed or adjuvant-treated control mice were stained using germinal center markers, B220 and GL7. (A) Kinetics of B220+ GL7+ germinal center B cells in splenocytes is indicated. Numbers in the contour plots indicate the relative percentages of the B220+ GL7+ population. The cells were recovered from tissues of four mice per time point, and the results are representative of one experiment repeated three times. (B and C) Scatter plots of percentages and bar graph of total numbers of B220+ GL7+ cells in spleen of PfMSP-119-primed mice are depicted. The values are geometric means ± SD values of six mice per time point. Experiments are representative of three repeats. ***, P < 0.001.

