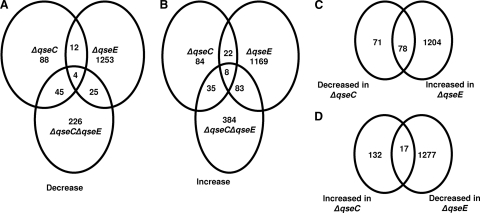
Fig 2.
Global analysis of QseC's and QseE's effects on EHEC O157 gene transcription. Venn diagrams show the number of overlapping downregulated (A) and upregulated (B) genes between the ΔqseC, ΔqseE, and ΔqseC ΔqseE mutant strains compared to the wt. (C) Venn diagram indicating genes that are decreased in the ΔqseC strain and increased in the ΔqseE strain. (D) Venn diagram indicating genes with expression that is increased in the ΔqseC strain and decreased in the ΔqseE strain. Strains for the microarrays were grown to an OD600 of 1.0 in low-glucose DMEM.

