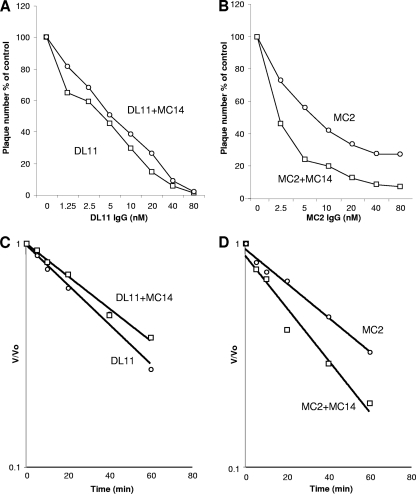
Fig 9.
Effect of MAb MC14 on the rate of virus neutralization by DL11 or MC2. (A and B) Neutralization with antibody concentrations. Comparison of DL11 plus or minus 80 nM MC14 (A) versus MC2 plus or minus 80 nM MC14 (B). In each experiment, serial 2-fold dilutions of DL11 or MC2 were mixed either with MC14 or with a control lacking Ig and then incubated with 100 PFU of virus for 1 h at 37°C. The virus-antibody mixtures were added to Vero cells, and plaques were allowed to develop. The results are expressed as percentages compared to the control lacking Ig. (C and D) Kinetics of neutralization. For this assay, the concentrations of MAbs were fixed and the time during which MAbs and virus were incubated was adjusted (0 to 60 min). At each time point, the virus-antibody mixture was rapidly diluted in growth medium and added to cells to measure the virus neutralization over time. The results are plotted as V/V0, where V is the number of plaques remaining at each time point and V0 is the number of plaques at time zero. This number was plotted against time. A straight-line relationship between V/V0 and time represents first-order kinetics, and the slope of the line represents the rate of virus neutralization. Results of a representative experiment are shown; each antibody was tested a minimum of three times.

