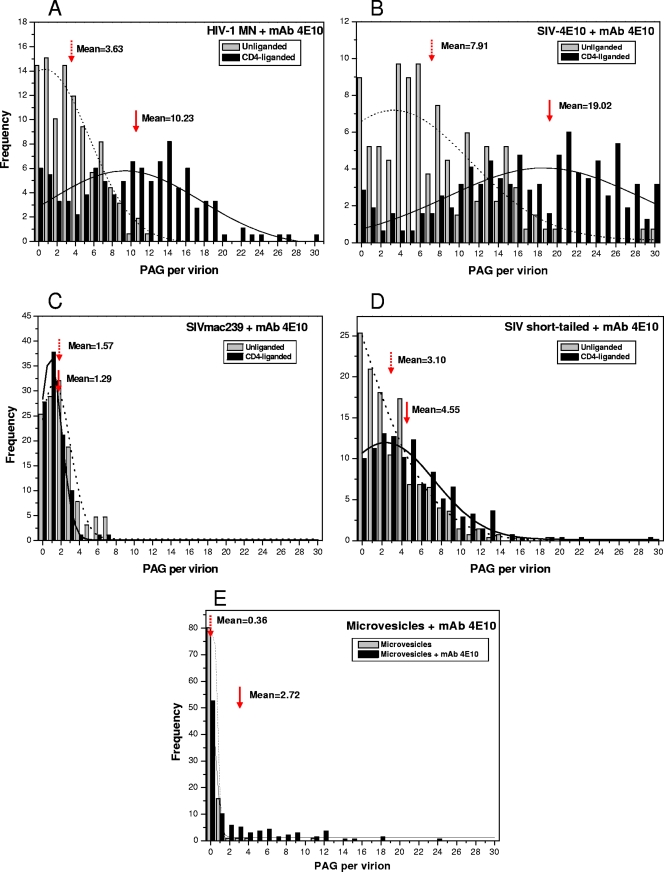
Fig 4.
PAG frequency analysis for MAb 4E10 bound to unliganded and CD4-preliganded virions and to microvesicles. The arrows indicate mean PAG/virion values. Gaussian curve fitting is used to represent the PAG distribution. The dotted and solid lines represent the unliganded and CD4-preliganded virions, respectively.

