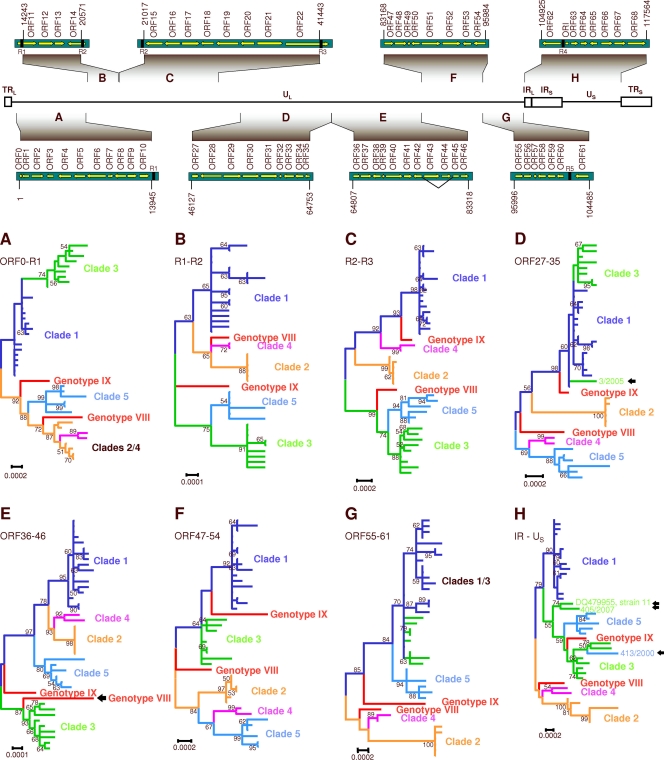
Fig 4.
Phylogenetic analysis of subgenomic regions. The upper panel shows schematic organization of the VZV genome, showing unique (UL and US) and repeated terminal and internal (TR and IR) sequences. Nucleotide positions and genes of the analyzed fragments are presented. The diagrams are not drawn to scale. Lower panels: overview of maximum-likelihood trees computed with MEGA5. Each established clade is indicated in a different color; proposed clades are indicated in red. Different clustering of certain strains along the genome suggests recombination events (indicated with arrows). (A) Fragment TR-R1. (B) Fragment R1-R2. (C) Fragment R2-R3 . (D) Fragment ORF27-35 . (E) Fragment ORF36-46. (F) Fragment ORF47-54. (G) Fragment ORF55-61. (H) IR-US. Scale bars indicate substitutions per site. Numbers at major nodes indicate bootstrap values obtained after 1,000 replications.

