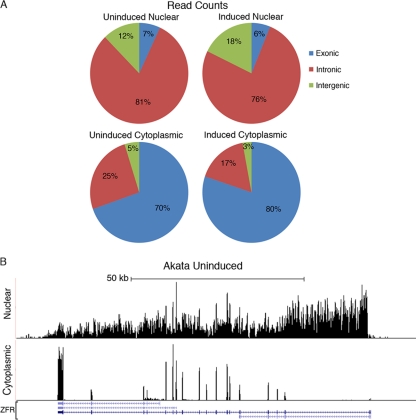
Fig 1.
(A) Human exonic, intronic, and intragenic read distributions for uninduced and induced nuclear and cytoplasmic sequencing data. (B) Nuclear and cytoplasmic RNA-Seq coverage data at the human ZFR locus. The y axis is the number of reads spanning each genomic coordinate (x axis). Four known isoforms for ZFR are shown at the bottom of the figure. Thick lines represent coding sequences, medium thickness lines represent untranslated regions, and thin lines with leftward arrows represent introns.

