Fig 3.
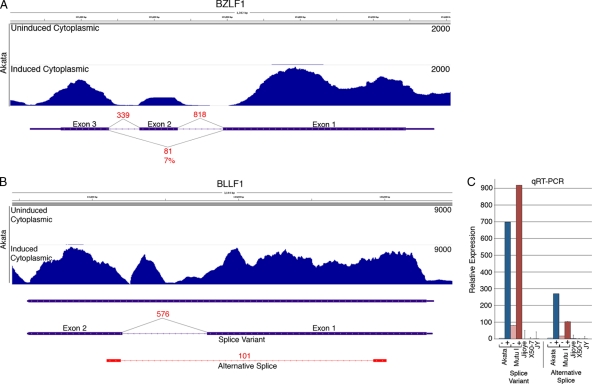
(A) Read coverage data (Novoalign) from uninduced and induced Akata cells and splicing evidence (from TopHat) from induced Akata cells are shown for the BZLF1/Zta locus. The y axis is the number of reads spanning each genomic coordinate (x axis). Thick lines represent coding sequences, medium thickness lines represent untranslated regions, and thin lines with leftward arrows represent introns. Evidence for the canonical BZLF1 splicing are represented by 818 and 339 reads spanning intron 1 and intron 2, respectively. Eighty-one reads spanning the exon 1-exon 3 splicing event correspond to the dominant-negative variant RAZ. (B) Coverage data and splicing evidence at the BLLF1 (gp350/gp220) locus show 101 reads spanning a novel splicing event. The peak within the annotated BLLF1 intron probably does not represent a stand-alone exon since no junction-spanning reads were identified at the peak edges. Instead, these reads are likely attributable to the unspliced version of BLLF1. (C) Relative expression of the BLLF1 splice variant and the alternative splice as determined by quantitative RT-PCR. RNAs from uninduced or induced Akata or Mutu I cells and from the type III latency cell lines Jijoye, X50-7, and JY are shown.

