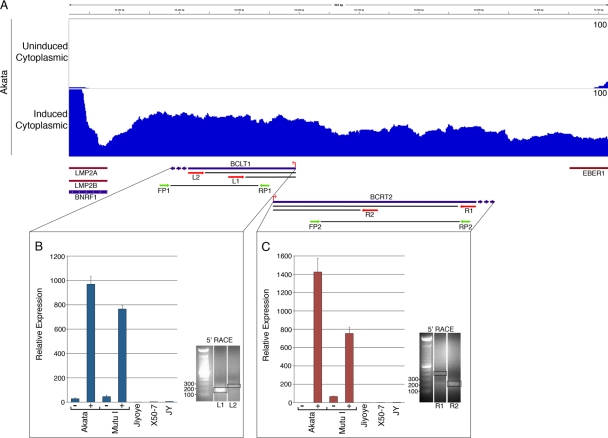
Fig 7.
(A) Coverage across new transcript region in induced Akata cells. Red arrows represent primers used for 5′ RACE. Green arrows represent PCR primers used for quantitative RT-PCR. (B) Real-time RT-PCR analysis (values are relative to the no-RT control in uninduced and induced conditions) of BCLT1 expression (B) and BCRT2 (C) and 5′ RACE identification of start sites. 5′ RACE products were cloned and sequenced. The start site was determined to be identical using either primer.

