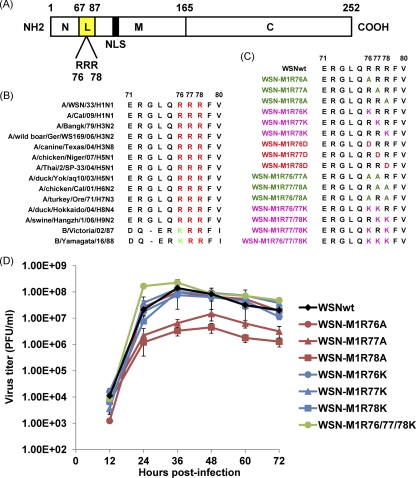
Fig 1.
Sequences of mutant M1 proteins at amino acid positions 76 to 78 and virus growth kinetics. (A) Schematic presentation of influenza A virus M1. The boundary of the three main domains is shown by the amino acid positions. N, N-terminal domain; L, the linker region (see reference 43; yellow); M, middle domain; C, C-terminal domain. The arginine residues (R) at positions 76 to 78 and the nuclear localization signal (NLS; 53) are also shown. (B) Alignment of M1 amino acid sequences of influenza A and B viruses. Shown are the amino acids at positions 71 to 80. Conserved arginine (R) and lysine (K) residues are shown in red and green, respectively. (C) M1 amino acid sequences of the mutant viruses used in the present study. Mutants are color-coded as follows: single alanine substitutions, light green; double alanine substitutions, deep green; single, double, and triple lysine substitutions, pink; single aspartic acid substitutions, red. (D) Growth kinetics of the M1 mutants. MDCK cells were infected with the indicated viruses at an MOI of 0.001. The culture supernatants collected at the indicated time points were subjected to plaque assays for virus titration. Error bars represent standard deviations of three independent experiments.

