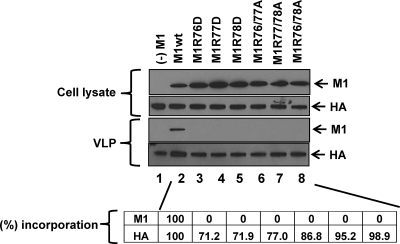
Fig 7.
Effect of the mutations on M1 incorporation into VLPs. 293T cells were transfected with an expression plasmid for either wild-type or mutated M1 along with expression plasmids for HA, NA, NP, M2, and NS2. At 48 h posttransfection, culture supernatants were subjected to Western blotting with anti-M1 and anti-HA monoclonal antibodies. Proteins in the cell lysates and VLPs are shown in the upper and lower panels, respectively. The intensity of bands for M1 and HA was quantified by using ImageJ software (NIH). The percentage of incorporation of M1 and HA into VLPs was calculated (the value for the wild-type VLP was set as 100%) by using the following formula: {ratio of the amount of protein in the mutant VLP to the total amount of mutant protein (VLP + cell lysate)/ratio of the amount of protein in the wild-type VLP to the total amount of wild-type protein (VLP + cell lysate)} × 100. The averages of three independent experiments are shown at the bottom of the gel images.

