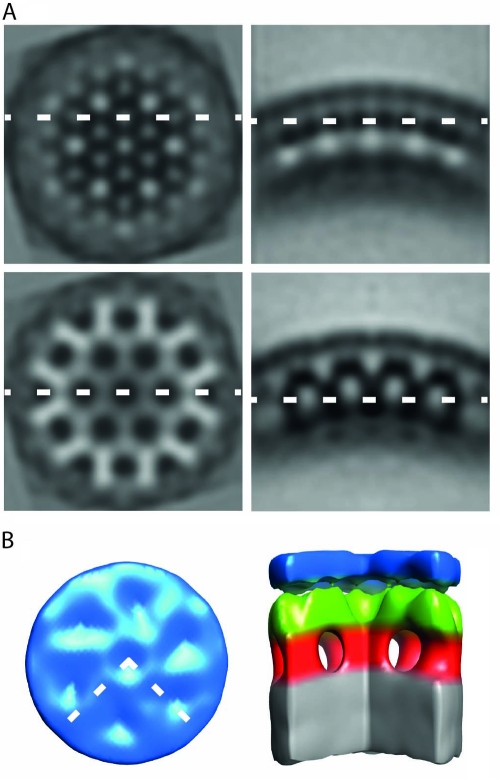
Fig 6.
Structure of in vitro-assembled particles of XMRV Δ10CANC. (A) Orthoslices through the average structure. On the right are radial sections, while tangential sections are on the left. The dashed lines show the relative position of the orthoslices between the panels. Density is black. (B) Surface rendering of the average structure. The color scheme follows an approximate radial division of the structure according to the different domains of Gag as previously assigned (12). Gray is the NC-nucleic acid layer, red is the region between NC and the CA-CTD, green is the CA-CTD region, and blue is the CA-NTD. The dashed lines in the top view represent the section cut out in the side view. The CA-NTD region does not show an ordered hexameric lattice.

