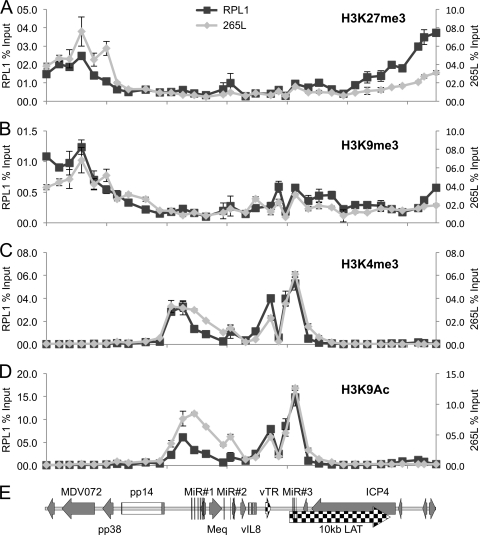
Fig 2.
Profile of histone 3 (H3) modifications across the repeats of MDV in T-cell lines. Chromatin immunoprecipitation was carried out with two MDV-transformed T-cell lines, RPL1 and 265L. Results are shown as percentages of total input, with RPL1 and 265L cell data shown on independent y axes and the x axis indicating positions (bp) across the MDV genome. Antibodies against specific histone modifications were used, with two against modifications related to repression (H3K27me3 [A] and H3K9me3 [B]) and two against modifications associated with activation (H3K4me3 [C] and H3K9Ac [D]). Thirty-four sets of primers were used for qPCR analysis. (E) Gene map of the region for reference.

