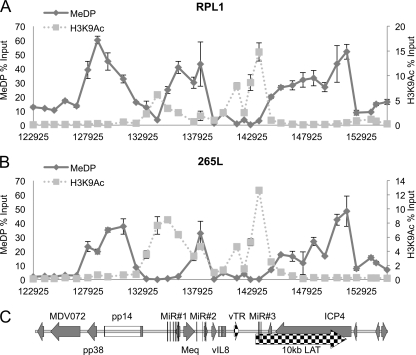
Fig 5.
CpG methylation analysis of MDV DNA from T-cell lines. Fragmented DNAs from RPL1 (A) and 265L (B) cells were subjected to methylated DNA precipitation as described in Materials and Methods. Again, 34 primer sets were used for qPCR, and the methylated DNA profile is shown as an unbroken line; for comparison, the H3K9Ac data from Fig. 2 are shown as a dotted line. Results are shown as percentages of total input, with H3K9Ac and methylation shown on independent y axes and the x axis indicating positions (bp) across the MDV genome. (C) Map of the region.

