Fig 10.
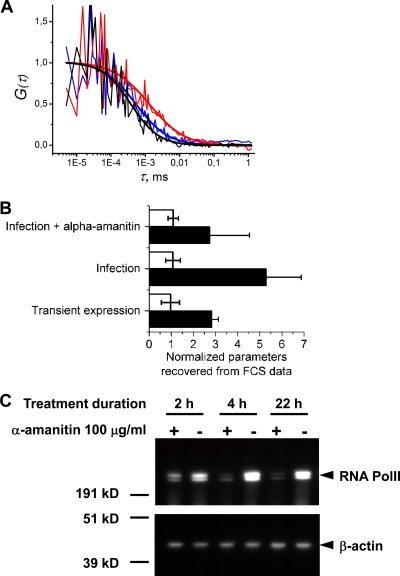
FCS analysis of PB2-GFPcomp protein dynamics in the nuclei of live infected cells. 293T cells transiently expressing GFP1-10 were infected at an MOI of 3 with the WSN-PB2-GFP11 virus, incubated in the absence or presence of 100 μg/ml α-amanitin from 2 h postinfection, and submitted to FCS measurements from 4 to 6.5 h postinfection as described in Materials and Methods. 293T cells cotransfected with the GFP1-10 and MBD-GFP11 expression vectors were used as a control. (A) Representative raw individual autocorrelation curves and the curves obtained by global fitting of 12 to 20 individual curves/condition are shown for cells expressing the MBD-GFP11 protein (black curves) and cells infected with WSN-PB2-GFP11 without (red curves) or with (blue curves) α-amanitin treatment. (B) The characteristic diffusion time (black bars) and molecular brightness (white bars) recovered from FCS data analysis. The values measured for PB2-GFP11 transient expression, WSN-PB2-GFP11 infection, and WSN-PB2-GFP11 infection in the presence of α-amanitin (originally in ms and in counts per second per particle, respectively) were normalized with respect to the corresponding values for the transiently expressed MBD-GFP11 protein. In each transfection/infection experiment, 8 to 20 individual autocorrelation curves were acquired for each condition. The diffusion time for each condition was determined from global fitting of all curves acquired under that condition. The data are shown as mean values ± SD of two to four independent transfection/infection experiments. (C) Western blot analysis of RNA Pol II steady-state levels in α-amanitin-treated cells. 293T cells were incubated in the absence (−) or presence (+) of 100 μg/ml of α-amanitin for the indicated time. Whole-cell lysates were prepared, loaded on a denaturing polyacrylamide gel, and analyzed by Western blotting using monoclonal antibodies specific for the human RNA Pol II large subunit and ß-actin, as described in Materials and Methods. Protein molecular mass markers (kD) are indicated.

