Fig 2.
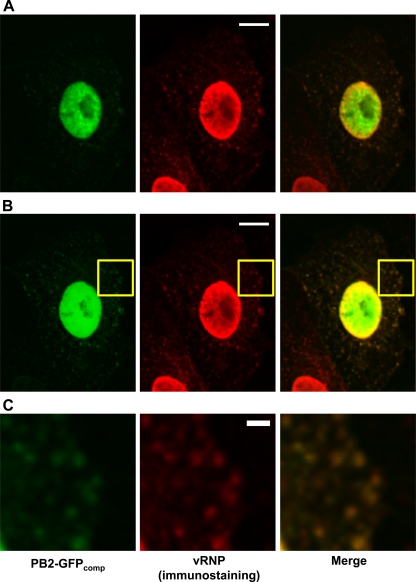
Colocalization of the PB2-GFPcomp signal with vRNP-specific immunofluorescence signal. Vero cells were transfected with the GFP1-10 expression plasmid, subsequently infected with the WSN-PB2-GFP11 virus at an MOI of 3, and fixed at 6 h 30 min postinfection. Immunostaining was performed as described in Materials and Methods, using the MAb 3/1. On the merged images, PB2-GFPcomp and immunostaining signals are pseudo-colored green and red, respectively. (A) The microscope settings were optimized for the acquisition of nuclear signals. Scale bar, 10 μm. (B) The microscope settings were optimized for the acquisition of cytoplasmic signals. Scale bar, 10 μm. (C) Zoomed-in image of the area defined by a yellow rectangle in panel B. Scale bar, 2 μm.

